How better data and modelling can reshape the way general practice funding reflects real need
New Zealand’s population and health system are changing fast. People are living longer, long-term conditions are more common, and access to primary care varies across communities. Yet the way practices are funded has not kept pace.
A nationally consistent capitation funding formula was first introduced in 2002, and this has been in use ever since. The formula was implemented as a mechanism to replace a spectrum of needs-based formulae used in some regions of New Zealand, while formula based on organisations’ historical fee-for-service were used in other parts of the country. The capitation formula aims to serve four primary objectives:
- Reduce the inequitable distribution of primary care resource across the country, arising from the use of varying formulae
- Better target resources to populations with higher health needs
- Promote enhanced roles for nurses and other members of a primary health care team, which was disincentivised under a fee-for-service model
- Promote the continuity of care of populations by providing incentives around understanding the enrolled population and their health needs.
The current capitation formula focuses primarily on age and sex, and their relationship with healthcare activity, to allocate aspects of primary care funding. While simple to apply, that formula overlooks other important drivers of health need and clinical workload. Sapere was commissioned by Health New Zealand | Te Whatu Ora to revisit and strengthen the capitation funding model, building on our earlier work from 2022.

Among all factors tested, age and gender remained the strongest predictors of activity, but adding measures of multimorbidity, deprivation and rurality improved the model’s accuracy. Ethnicity was also found to be an important predictor of activity, capturing elements of primary healthcare utilisation that was not explained by other variables.
Bringing better data to the funding conversation
Using a nationwide database of 2.48 million patient records across 469 practices, we conducted analysis that represented half of all enrolled patients in New Zealand. The breadth of information allowed us to see how different patient and community factors influence activity in general practice.
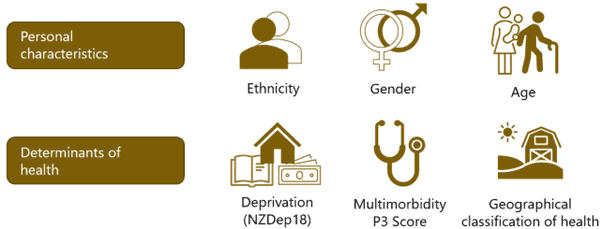
Using multivariate regression modelling, we explore how key characteristics – including age, gender, socio-economic deprivation, multimorbidity, geography and ethnicity – contribute to variations in primary healthcare use and cost. The analysis captured both patient-facing time and essential non-contact clinical work, to attempt to provide a realistic view of how much resource each patient group requires.
Figure 1: Patient characteristics controlled for in analysis

A more complete picture of primary care
The results confirmed what many in the sector have long suspected: practices serving people with greater health complexity, higher deprivation or living in rural areas carry a heavier workload. Older adults and young children generate more consultations, and time required to manage patients with multiple conditions is significantly higher.
Among all factors tested, age and gender remained the strongest predictors of activity, but adding measures of multimorbidity, deprivation and rurality improved the model’s accuracy. Ethnicity was also found to be an important predictor of activity, capturing elements of primary healthcare utilisation that was not explained by other variables.
Building on these findings, we produced a revised set of relative capitation weights that better reflect the true clinical effort in delivering care. The model enables policymakers to simulate how different funding distributions would affect practices with varying population profiles.
We simplified the model into 24 age–sex groups and 13 adjustment factors that reflect other key influences on healthcare use. Together, these form 2,160 representative “profiles” of patients, covering the full range of New Zealand’s enrolled population.
The graph below summarises the average predicted “weight” for each characteristic. A weight above one means that group tends to use more primary care service than average, while a weight below one means less than average.
Figure 2: Mean weights by characteristic

Note:
- EA = European and Asian, MPO = Māori, Pacific peoples, and Other ethnicities;
- GCH: U1, U2, R1 urban and semi-rural areas; R2 and R3 rural and isolated areas
- P3: lower score = less comorbidity, higher score = more comorbidity
Rigorous, representative, and ready to inform policy
The methodology was closely monitored by a Technical Advisory Group throughout development. Their independent statement confirmed that the process was “open and robust… a rigorous and considered manner of deriving weightings that better match actual service workload”.
Our findings have already informed work by Health New Zealand | Te Whatu Ora on improving primary health care funding. Insights from this analysis were referenced in official advice on capitation reweighting and primary health care funding improvements, available here:
Our team included
Evidence-based reform starts with good data
For government agencies or organisations seeking to review or redesign funding frameworks, Sapere brings the analytical depth and policy expertise to ensure those changes are both credible and impactful.
To learn more about Sapere’s work in health economics, data modelling, and policy design – or to discuss how we can support your organisation – contact our team.

