

WRITTEN BY
Angus White
THE TEAM INCLUDED
Rohan Trill
Dr Jamie O’Hare
Michael Young
Preston Davies
EXPERTISE INVOLVED
Economic & Market Analysis
Financial Modelling
1 April 2026 | 4 MIN READ | CLIENT: MINISTRY OF BUSINESS, INNOVATION AND EMPLOYMENT
Tracking tourism funding flows, economic impacts, and associated infrastructure investment under the Tourism Growth Roadmap
Tourism growth is a significant opportunity for New Zealand’s economy, but it also creates demands on infrastructure and public investment. Sapere examines tourism funding flows, economic impacts and infrastructure needs to inform sustainable growth under the Tourism Growth Roadmap.

Why do tourism funding flows matter?
The government’s Tourism Growth Roadmap (Roadmap) has objectives of growing tourism exports to $19.8 billion and international visitor arrivals to approximately 4.78 million by 2034. In light of these targets and MBIE’s wider work to support the Roadmap, we were asked to provide analysis of tourism funding flows across stakeholders, along with the economic impacts of tourism, and to offer a high-level indication of potential infrastructure pressures associated with the Roadmap.
Our report provides important context for understanding the various figures and estimates, noting challenges in comparing across measures and distinctions in what each measures. Here we summarise some of our key findings.
Almost $40 billion in direct tourism spending generates a multiplier effect of between 1.7 and 1.9, with up to $2.2 billion to $3.5 billion in infrastructure investment potentially needed.
What is the level of spending associated with tourism and what is the flow on impact?
In the year to March 2023, almost $40 billion in direct tourism spending (now $44.4 billion in the year to March 2024) generates a multiplier effect of between 1.7 and 1.9 (see Figure 1).
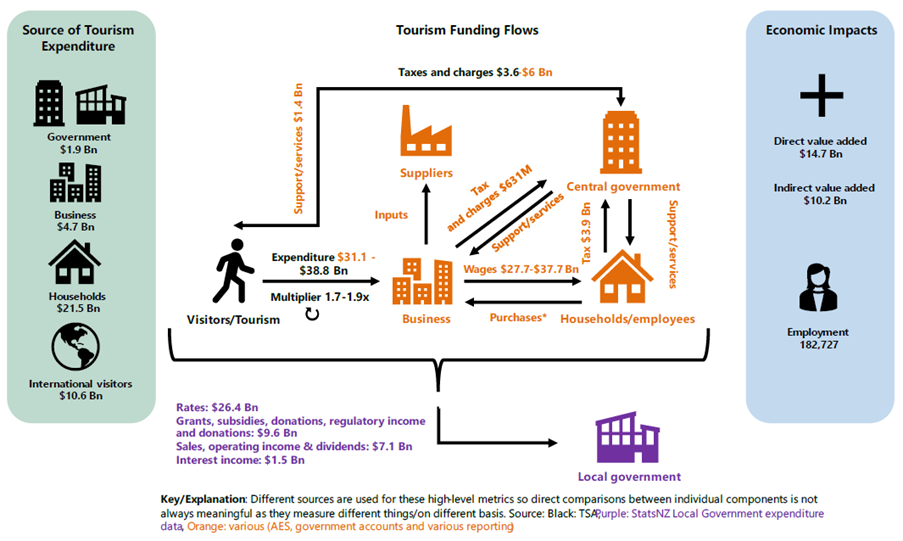
Figure 1: Overview of funding flows and economic impacts
What are the economic impacts and components of tourism?
Statistics New Zealand’s tourism satellite account provide estimates that $38.8 billion was spent in relation to tourism, contributing $24.9 billion of direct and indirect value added and over 182,727 of direct employment in 2023. Tourism’s direct impact is around 3%-5% of GDP across both metropolitan and non-metropolitan groups and a larger share of tourism’s value flows through wages paid to employees compared to the wider economy.
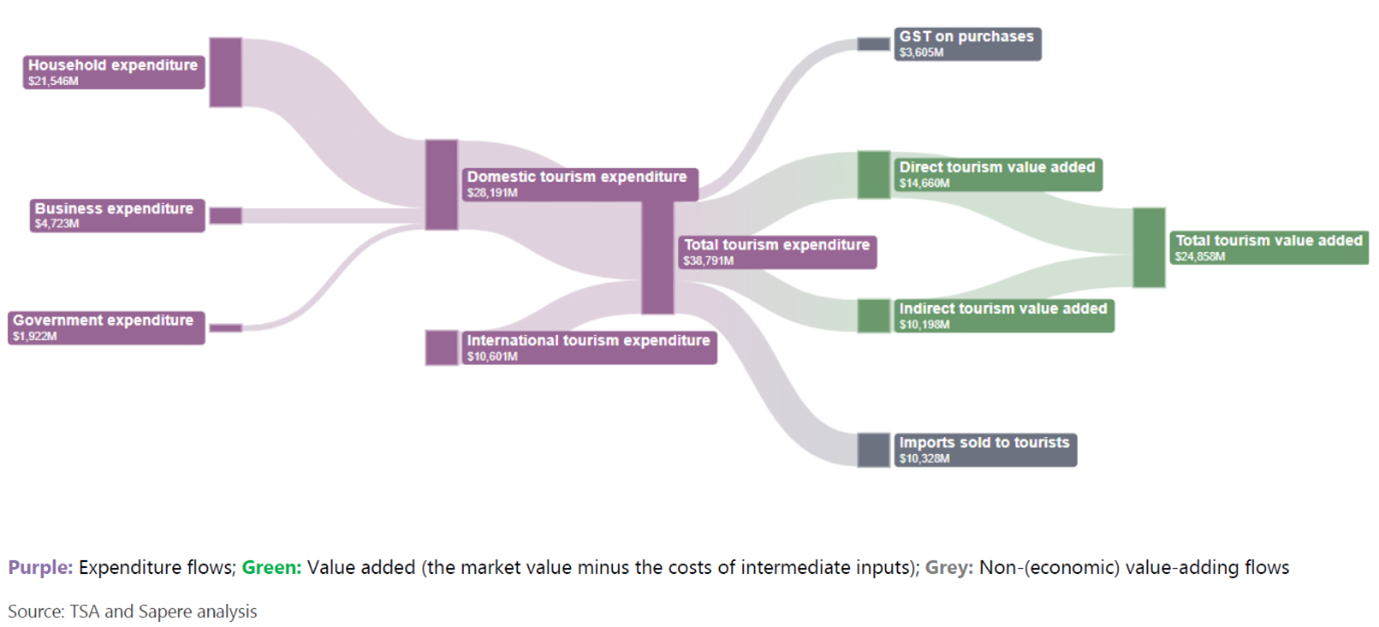
Figure 2: Tourism expenditure and national economic impacts (2023)
What do tourism spending flows look like across stakeholders?
Tourism expenditure is significant nationally. Tourism spending spans a number of industries and regions, and is fairly labour intensive.
- Looking across sources, we identify $10.5 billion of central government revenue from tourism, and $1.4 billion of spending in attracting and supporting tourism more widely
- Tourism-related revenue and expenditure at the local government level cannot be reliably identified, and many funding flows are indirect (though we set out key areas of spending and their funding sources)
- Industry receives an estimated tourism-related income of at least $31.1 billion relative to attributed expenditure of at least $27.7 billion, and international visitors face charges of around $50 to $500 upon landing.
What key infrastructure pressures have been previously identified relating to tourism?
Past work has identified tourism pressures in key hotspots and in areas where visitor numbers are high relative to the resident population. For example, this is shown in Figure 8 alongside the ratio of peak to trough monthly visitor days by RTO over the past year and key sector priorities highlighted in destination management plans. Seasonality is common across RTOs, affecting peak capacity, with peak visitor numbers often several times higher than average levels. This has implications for infrastructure efficiency, visitor experience and long term sustainability. Destination management plans have also highlighted priority areas where pressures or gaps have been identified, including accommodation capacity; access and transport; three waters infrastructure; and public facilities such as waste collection, public toilets, parking and signage.
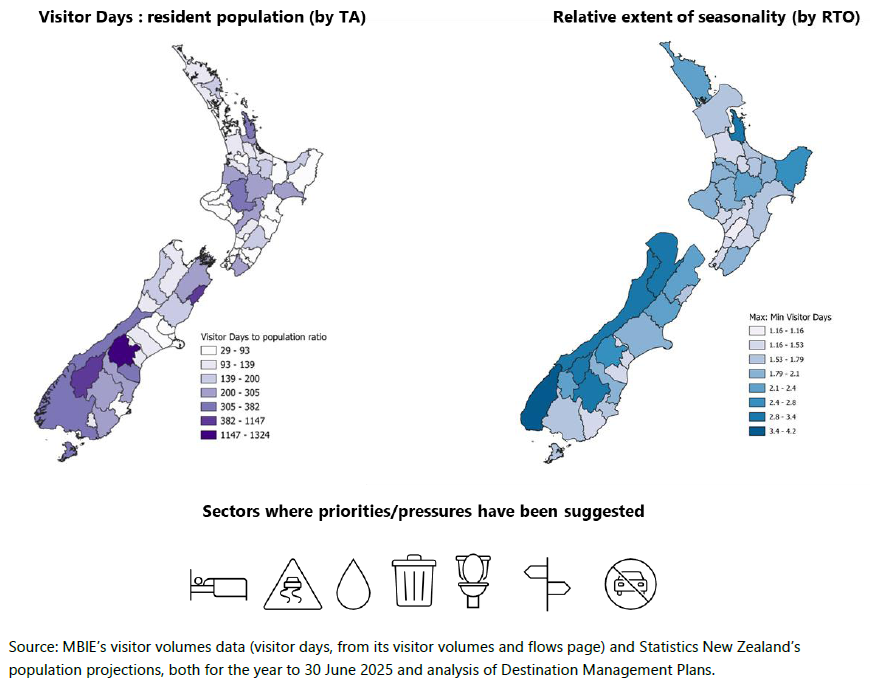
Figure 3: Key sources and drivers of infrastructure pressures
What additional infrastructure needs might come as a result of increased growth in tourism?
Additional growth under the TGR could add in the order of up to $2.2 billion to $3.5 billion of infrastructure investment needs between now and 2034. Of this estimate:
- 32 per cent relates to road transport, 27 per cent electricity and gas supply, 18 per cent to three waters and waste, and 14 per cent telecommunications
- 46 per cent relates to privately owned, 33 per cent to local government-owned, and 21 per cent central government-owned infrastructure.
However, we note that actual infrastructure investment needs will depend on future travel patterns, existing infrastructure capacity, and investment plans and residential growth.
The bottom line
Tourism contributes significantly to the New Zealand economy. Spending flows are both direct and indirect, with tourism supporting employment and leading to flow on economic activity. The impact of tourism spans a number of sectors and regions. The infrastructure supporting tourism is a mixture of central and local government owned and privately owned with cost recovery also mixed from direct full cost recovery through to indirect/partial cost recovery and there are pressures expected particularly in certain locations. With additional tourism growth envisaged under the Roadmap, high-level estimates are that additional infrastructure needs could be in the order of $2.2 billion to $3.5 billion, noting that actual infrastructure investment needs will depend on future travel patterns, existing infrastructure capacity, and investment plans and residential growth.
A final reflection
At Sapere, our research helps guide government policy and provides evidence to inform decisions that affect communities across New Zealand. Understanding how sectors of economic activity contribute to different stakeholders and regions and the associated support needed to benefit from and be prepared for growth in these activities is important to support achieving the most from these activities.